Timing the Bitcoin Market: Yay or Nay?
After an 8% overnight drop in BTC price, a friend of FNDX asked if it was a good time to buy. Rather than provide a bald answer on the lines of “it’s all speculative in the short term”, we presented data.
Specifically, we looked at what the one year BTC gain has historically been after an 8% or more 24H drop in price.
The friend asked us on Wednesday 14th Sep 2022, so we looked at five year data from 15 Sep 2017 to 14 Sep 2022 .
It turns out that in the last five years, 1827 days, there have been
65 days with >8% 24H gain
48 days with >8% 24H loss
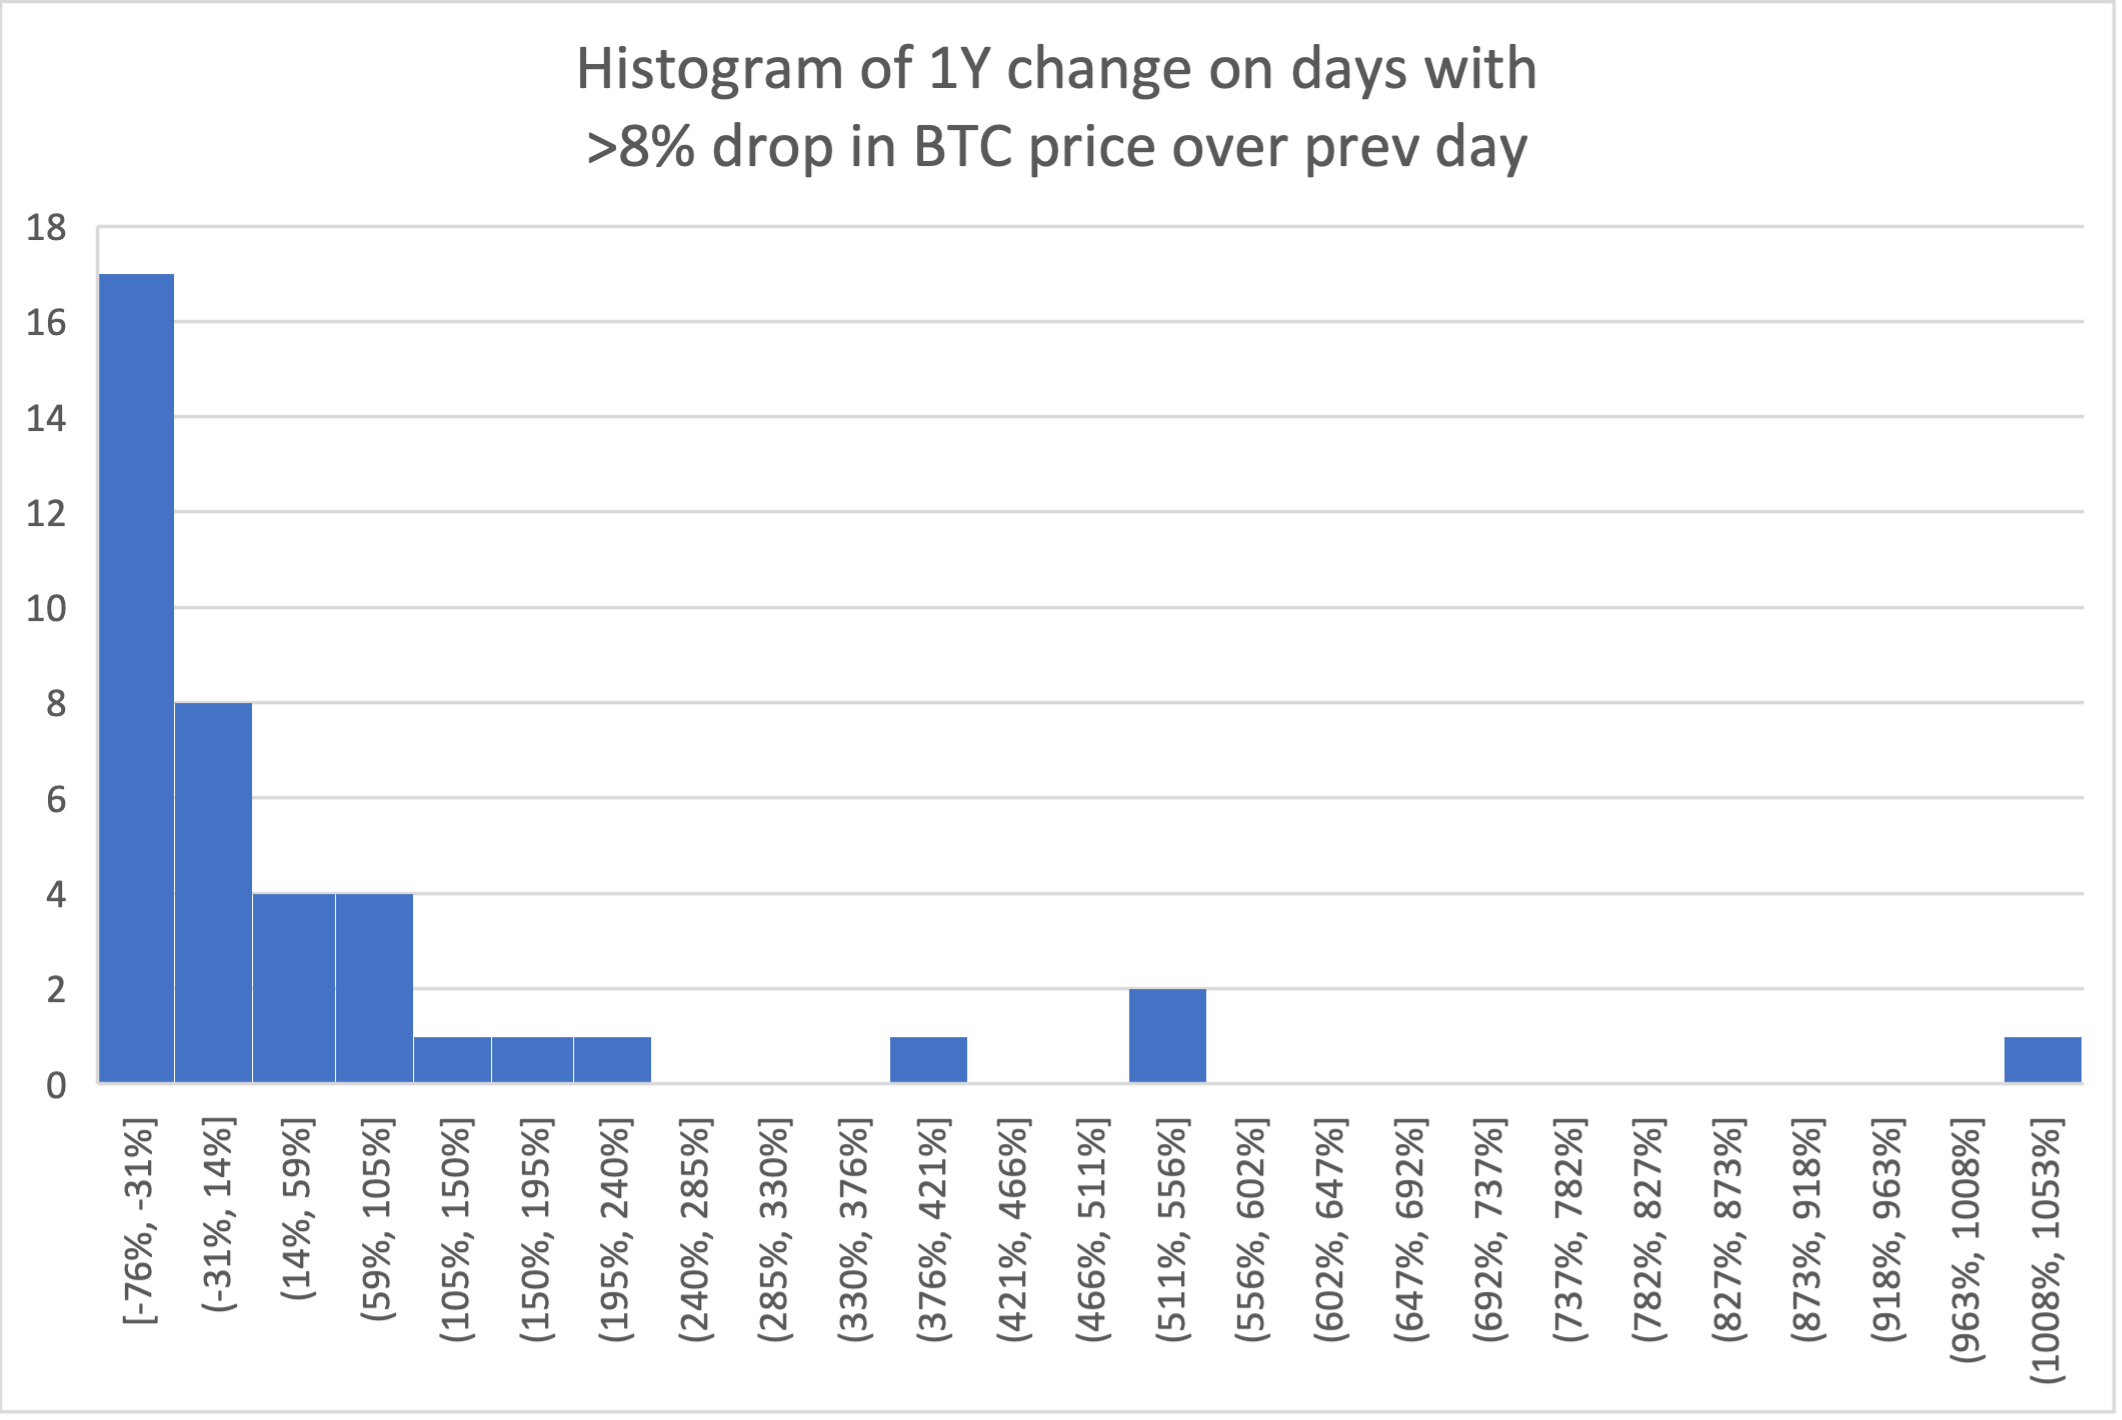
If you had in fact bought BTC on a day with >8% drop in price over previous day,
Your average 1Y gain would be 58%
Your median 1Y gain would be -20%
The median suggests that you'd be more likely to end _lower_ than higher. And sure enough, here is the histogram of 1Y gains.
But what if you bought BTC with >8% _rise_ in price over previous day? Well,
Your average 1Y gain would be 75%
Your median 1Y gain would be -8%
The histogram looks much the same:

So it doesn't matter whether you bought BTC after an 8% rise or drop in price over the previous day, you'd still be more likely to lose money in dollar terms than gain.
And what if you bought it on any day in the last five years? Surprisingly,
Your average 1Y gain would be 107.46%
And media 1Y gain would be 36.87%
And here’s the histogram. Note where the 0% marker is on the X axis:
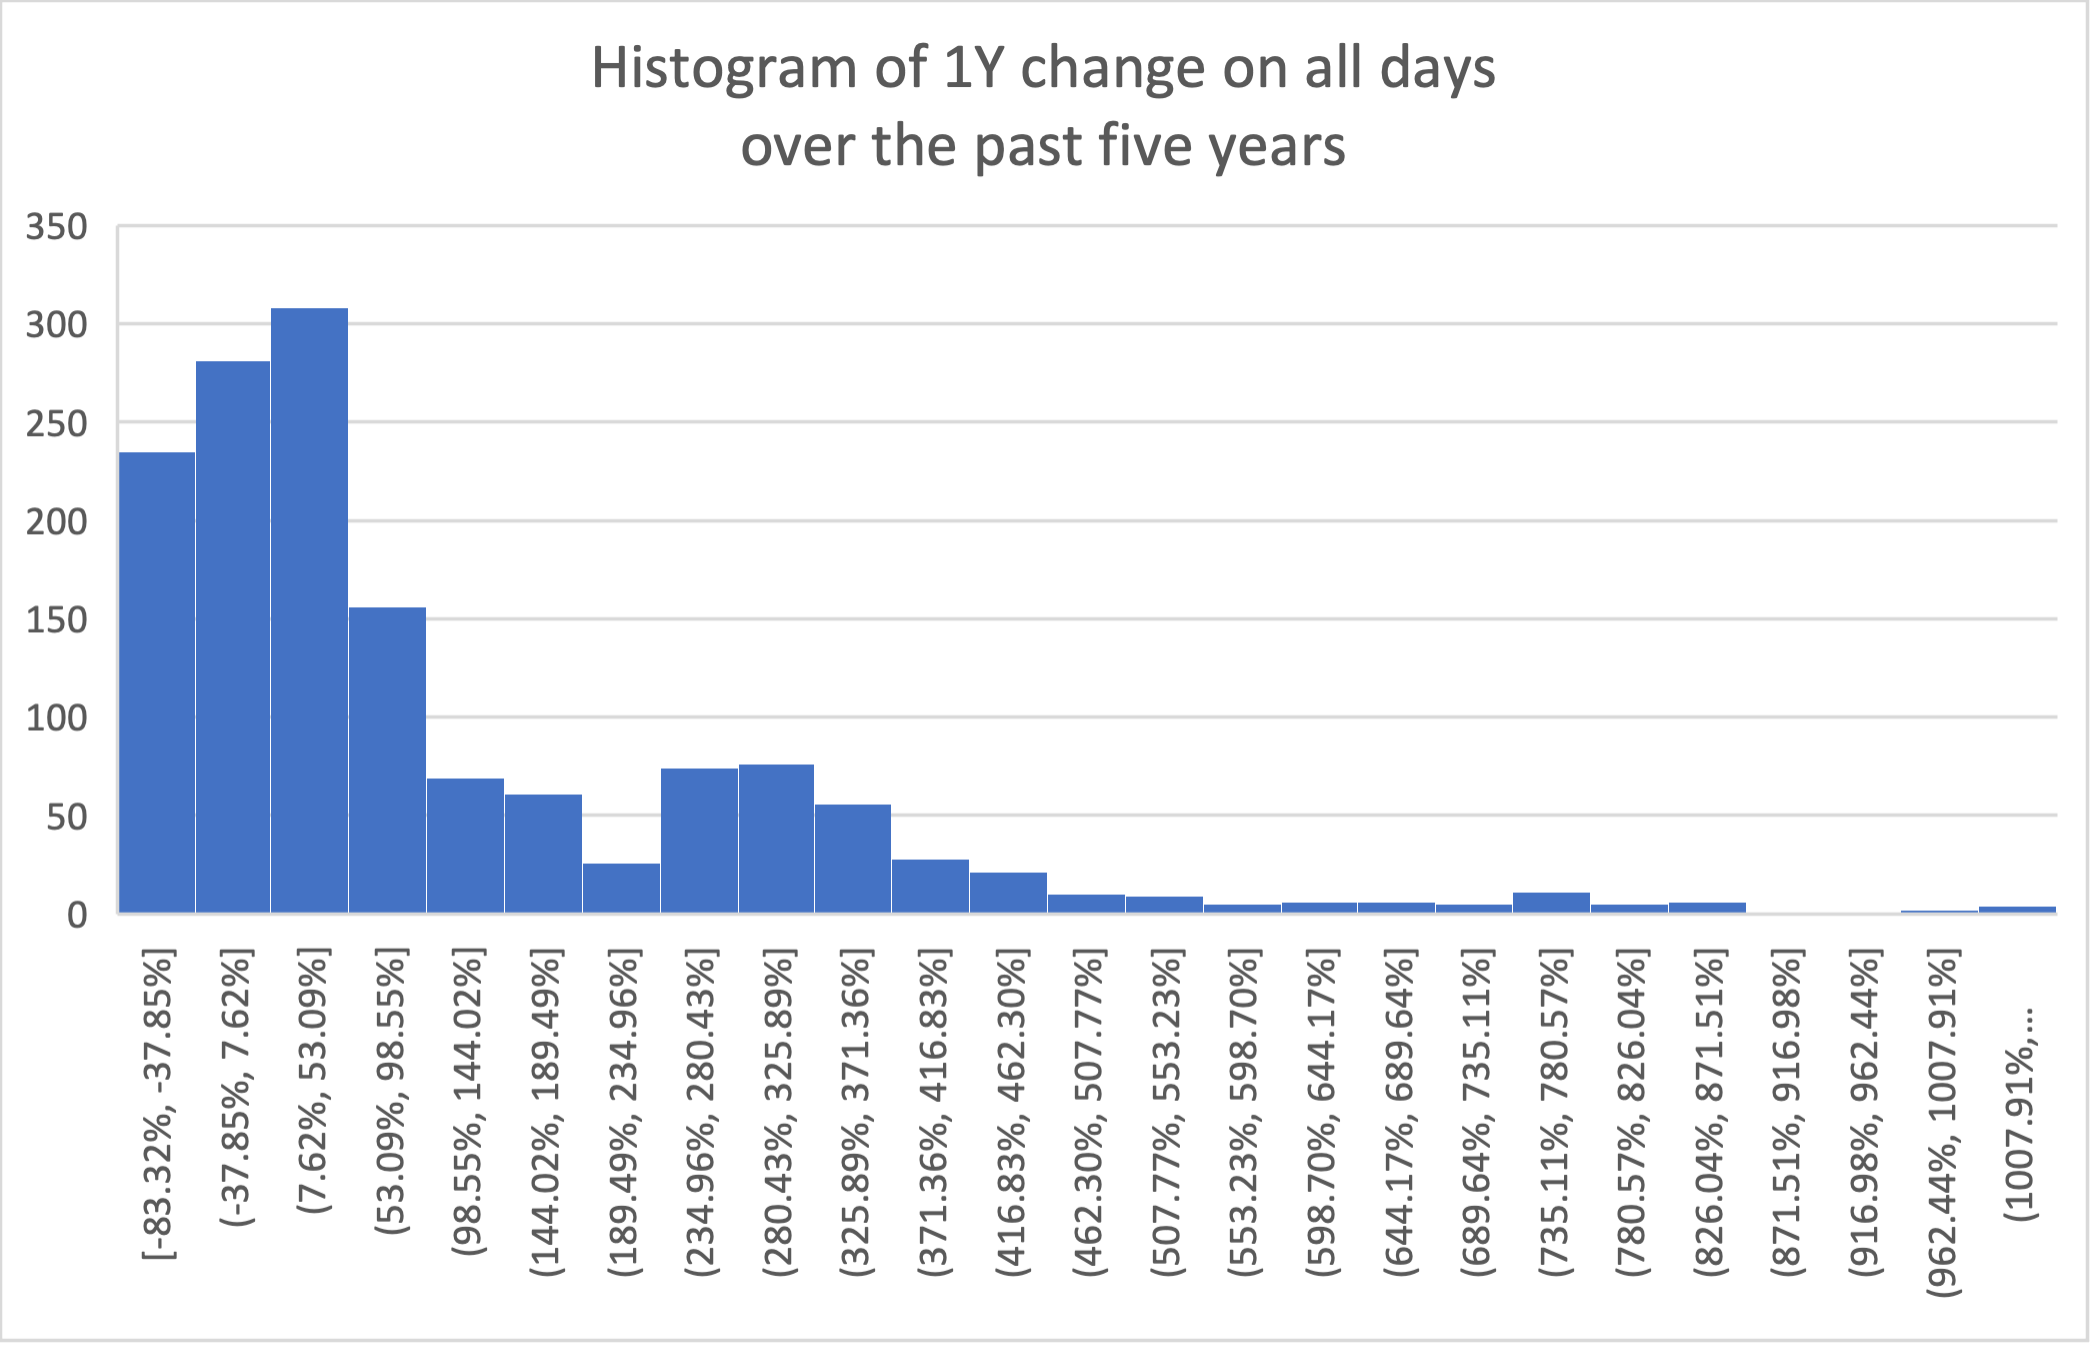
“You’re more likely to end with a 1Y gain by buying on any arbitrary day in the last five years than on a day with an 8% rise or drop in prices. This is notable.”
Let's make a final push and invert the question. If we took the top 10% (ie 180) days with the highest 1Y gains, what was the 24H rise/drop scenario?
In other words, what 24H rise/drop % is mostly likely to result in a high 1Y gain?
It turns out that of the 182 days with the highest 1Y gains in the last five years,
Your average 1Y gain would be 0.02%
Your median 1Y gain would be 0.25%
And here's the histogram:

The peaks are between -1% and +@2%.
“This means in the last five years, if you wanted to maximize your chances of a one year gain in Bitcoin price, you would have been better off buying Bitcoin on days with very little price movement over the previous day! ”
This is quite the opposite of the hypothesis we began with - that a sharp drop in fall (8% or more over the previous day) - was a 'good time' to buy Bitcoin.
★